The Dashboard
See What's Going On
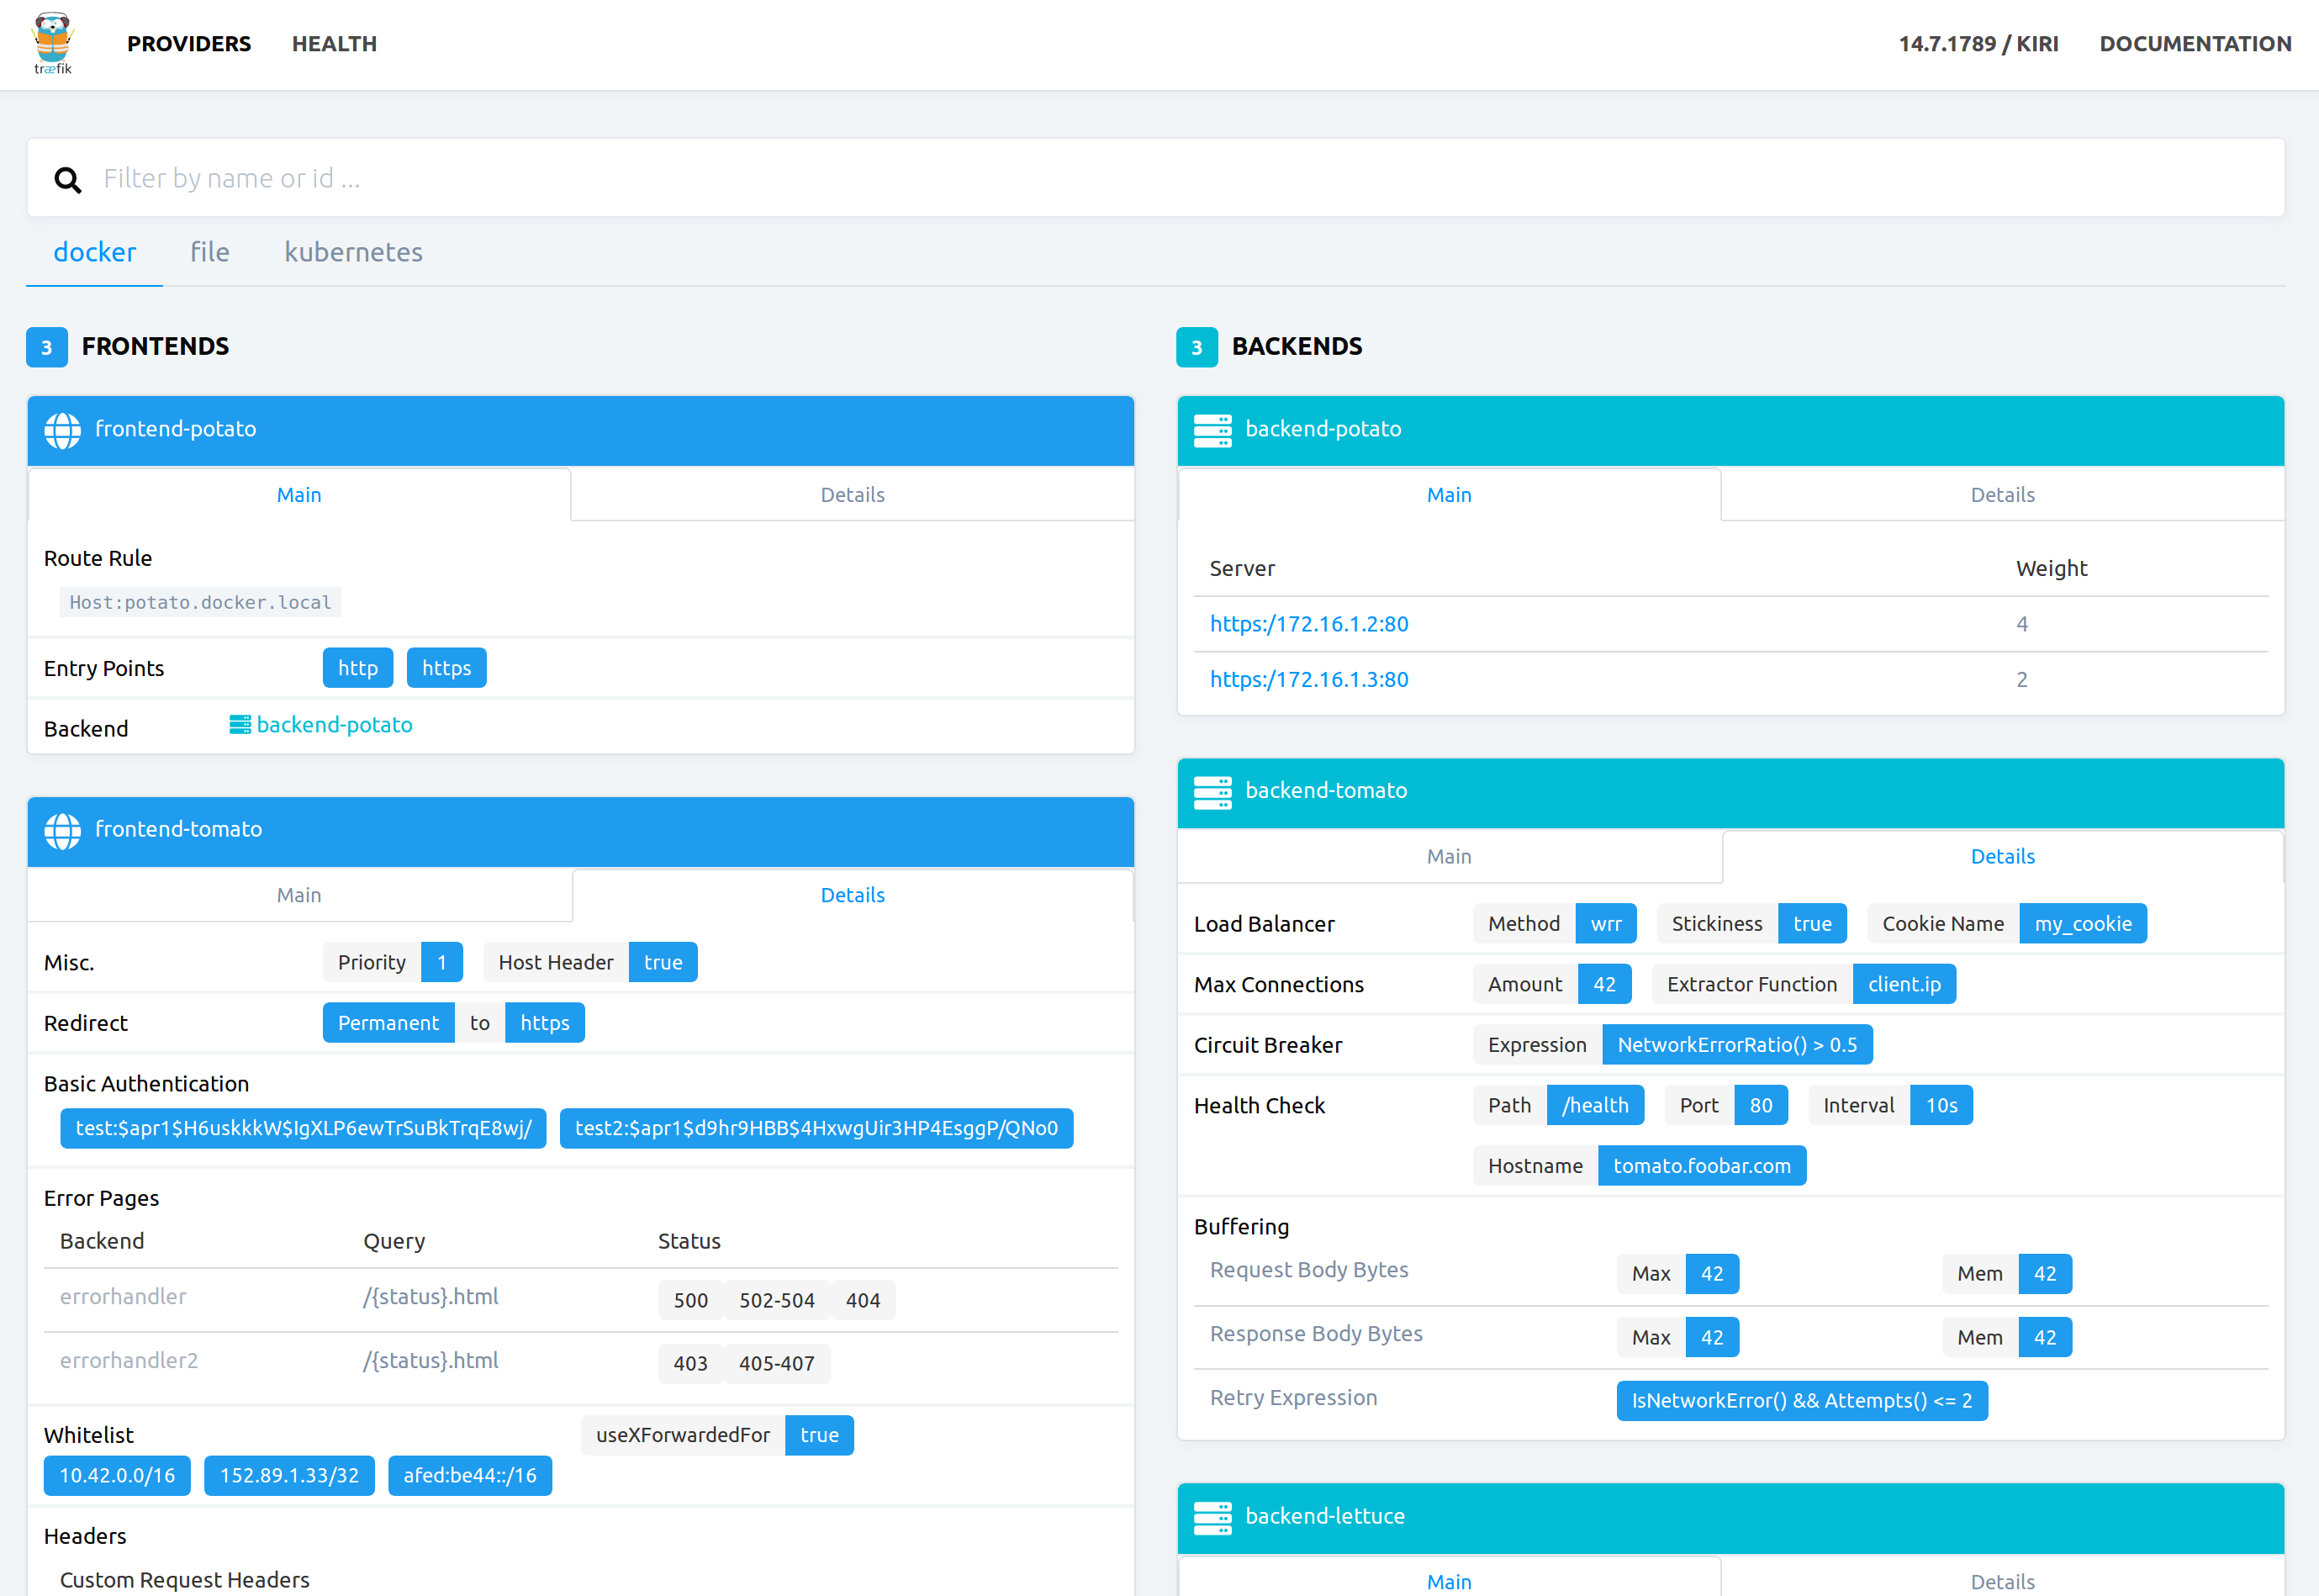
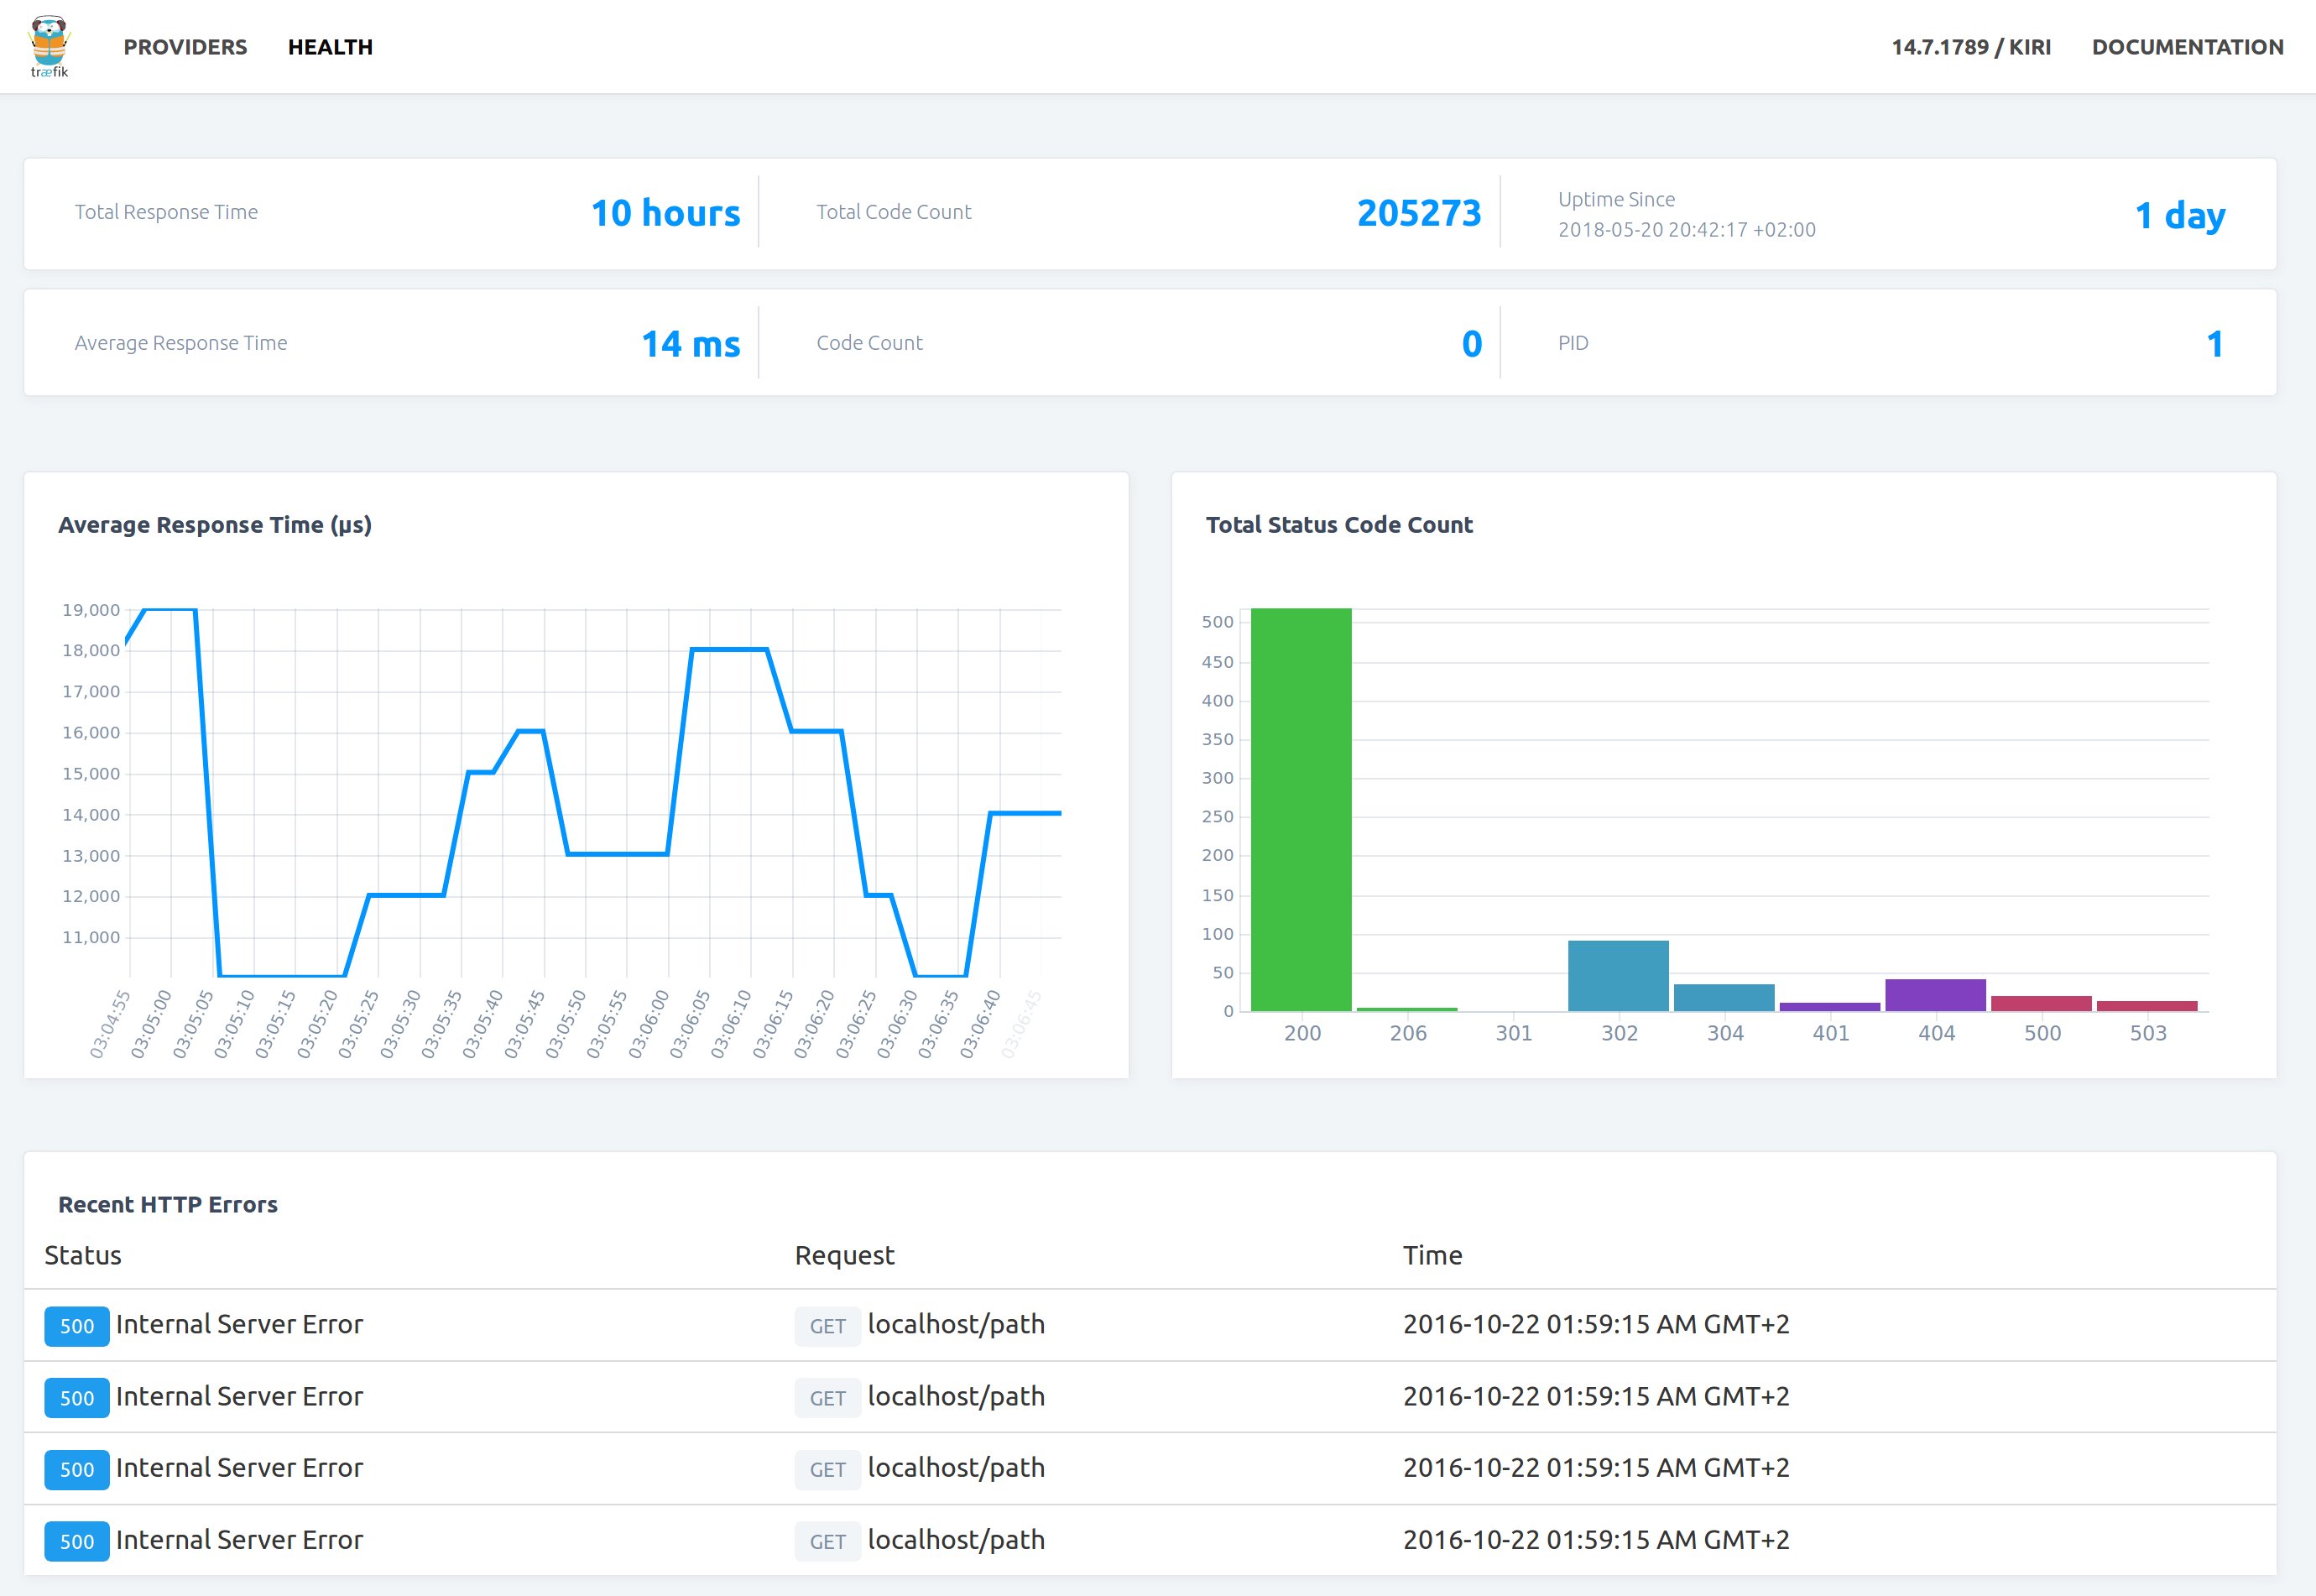
The dashboard is the central place that shows you the current active routes handled by Traefik.
Dashboard WIP
Currently, the dashboard is in a Work In Progress State while being reconstructed for v2. Therefore, the dashboard is currently not working.
By default, the dashboard is available on / on port :8080.
Did You Know?
It is possible to customize the dashboard endpoint.
To learn how, refer to the Traefik's API documentation(TODO: add doc and link).
Enabling the Dashboard
To enable the dashboard, you need to enable Traefik's API.
[api]
  # Dashboard
  #
  # Optional
  # Default: true
  #
dashboard = trueapi:
# Dashboard
#
# Optional
# Default: true
#
dashboard: true# Dashboard
#
# Optional
# Default: true
#
--api.dashboard=trueTo learn more about configuration options in the command line, refer to the configuration overview
To learn more about the configuration file, refer to configuration overview
Did You Know?
The API provides more features than the Dashboard.
To learn more about it, refer to the Traefik's API documentation(TODO: add doc and link).